API overview
What's possible with the API
An API request will, for any specified region and time of interest, generate an indicator of habitat condition. The following objects will be returned which summarize, and enable exploration of trends in, habitat condition:
- A time series plot of habitat condition
- Images of habitat condition for the region and time window of interest
- Habitat condition datasets (GeoTIFF) for time window of interest (accessible via a link)
- Summary metrics
API functionality
The API provides a superset of what is offered via the exploration website. Assessments of habitat condition are currently possible, but understanding habitat condition only represents part of the story in assessing the impact of any land action on biodiversity. Changes in habitat condition (observed or forecast) need to be translated into how they will affect the capcity of biodiversity to persist in order to better judge their significance. An indicator which provides estimates of biodiversity persistence will be available soon.
Basics
To make an API request, you will need to authenticate, and supply a spatial polygon defining your region of interest. There are a couple of ways to use the API: either via a programming language, or by using the API docs (OpenAPI specification documentation). Here's some examples for how to use the API programatically. For the rest of this section, we'll cover the use of the API from the API docs page. The API docs page provides a lower-level description of the API structure. If you're familiar with using APIs, hopefully it'll seem like familar territory. If not, then what is really useful about the API docs page is the ability to use the page as a user interface to the API. What this means, is that you can type or paste data directly into the API docs page to determine the type of assessment you want to make, execute the assessment, and you'll get a response back for your region of interest. There are even a bunch of examples there to make using the API as clear as possible.
Authentication
To use the API you'll need an access token. This can be retrieved from the LOOC-B user-interface. Once you've logged in to the user-interface, a token will be listed in your profile page. Go ahead and copy this. Note that tokens expire after a day, so you'll need to retrieve a new token each day you use the API.
To use the API via the API docs click the  button, and enter your token. To use the API programatically, see the examples.
Region of interest
A region of interest is specified by supplying a valid spatial polygon. Presently, this is required to be in GeoJSON format. Here's an example defining a polygon in Tasmania:
{
  "type": "FeatureCollection",
  "features": [
    {
      "type": "Feature",
      "properties": {},
      "geometry": {
        "type": "Polygon",
        "coordinates": [
          [
            [
              147.6727294921875,
              -42.64406114661688
            ],
            [
              147.67822265625,
              -42.67637788071963
            ],
            [
              147.7276611328125,
              -42.68243539838621
            ],
            [
              147.7496337890625,
              -42.642040793044266
            ],
            [
              147.6727294921875,
              -42.64406114661688
            ]
          ]
        ]
      }
    }
  ]
}
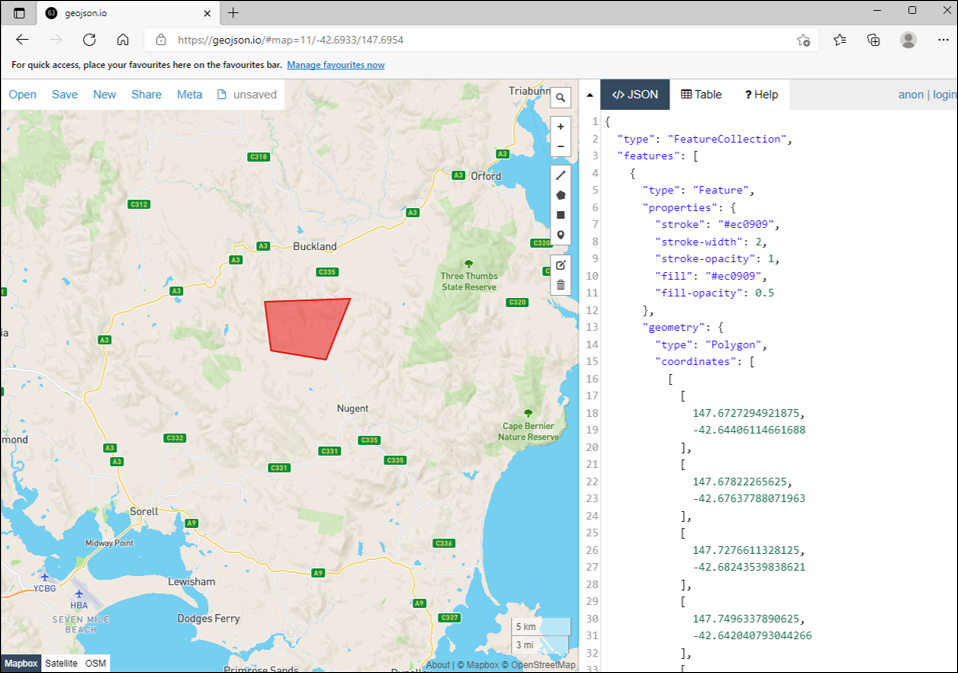
This can be viewed (and edited) using websites such as geojson.io:
Make a request
Once authenticated and you have a spatial polygon of interest at hand, you can test the API.
There are two assessment API endpoints: monitoring and planning. These correspond to the two modes in which assessments can be made. The monitoring mode is used to assess the outcomes of already-implemented actions, whereas the planning mode is used to forecast the outcomes of planned actions.
To see how to configure a request in the API docs, you can take a look at the provided examples. Clicking on the /monitoring endpoint button reveals the following:
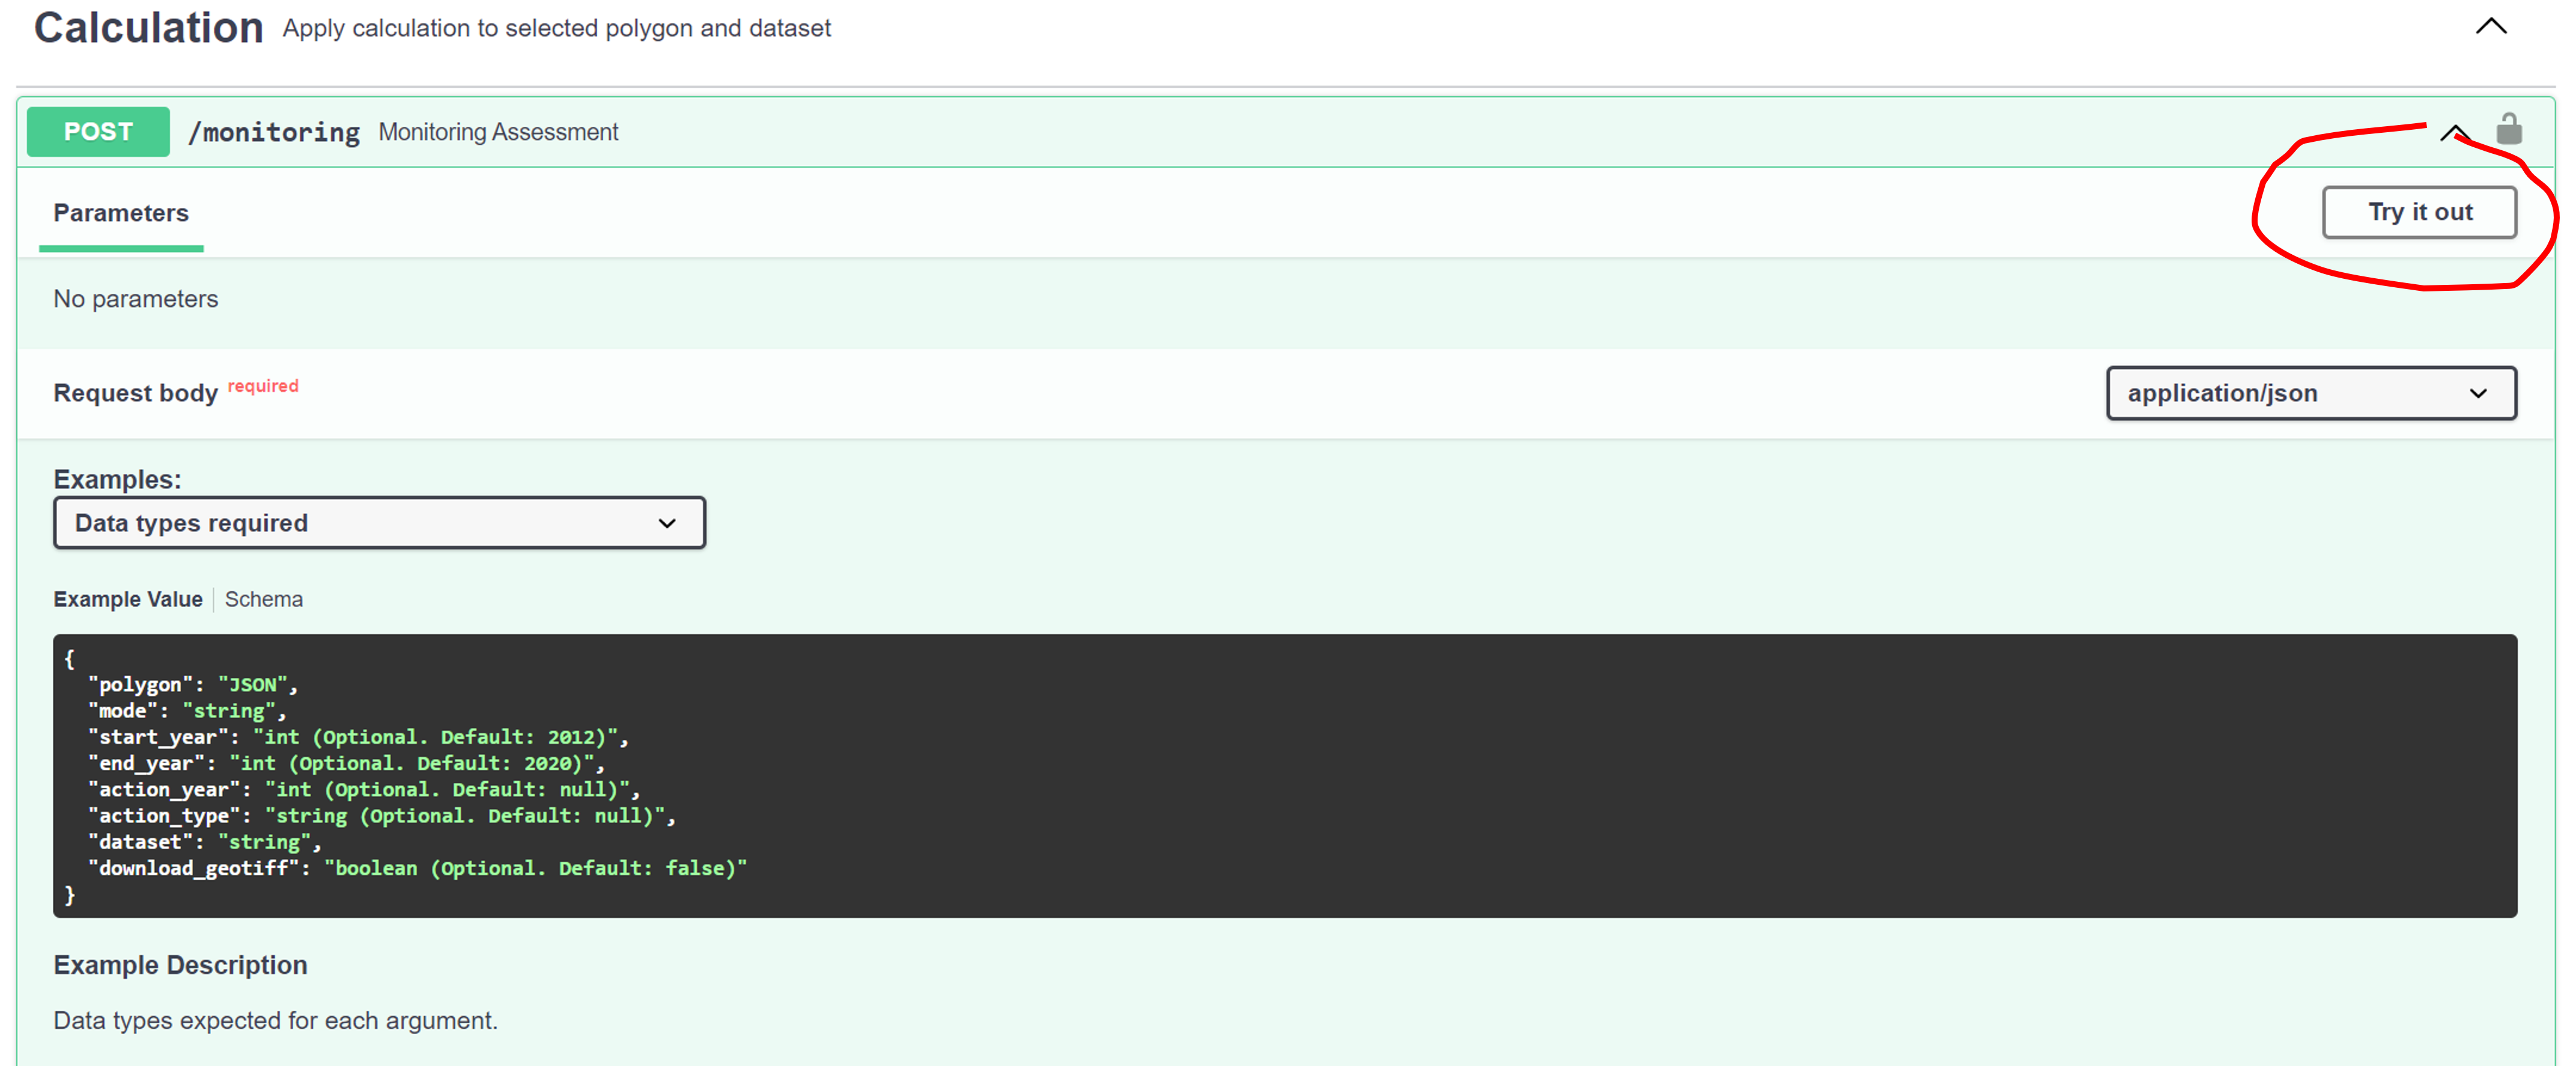
Hit the ![]() button, which reveals the following:
button, which reveals the following:
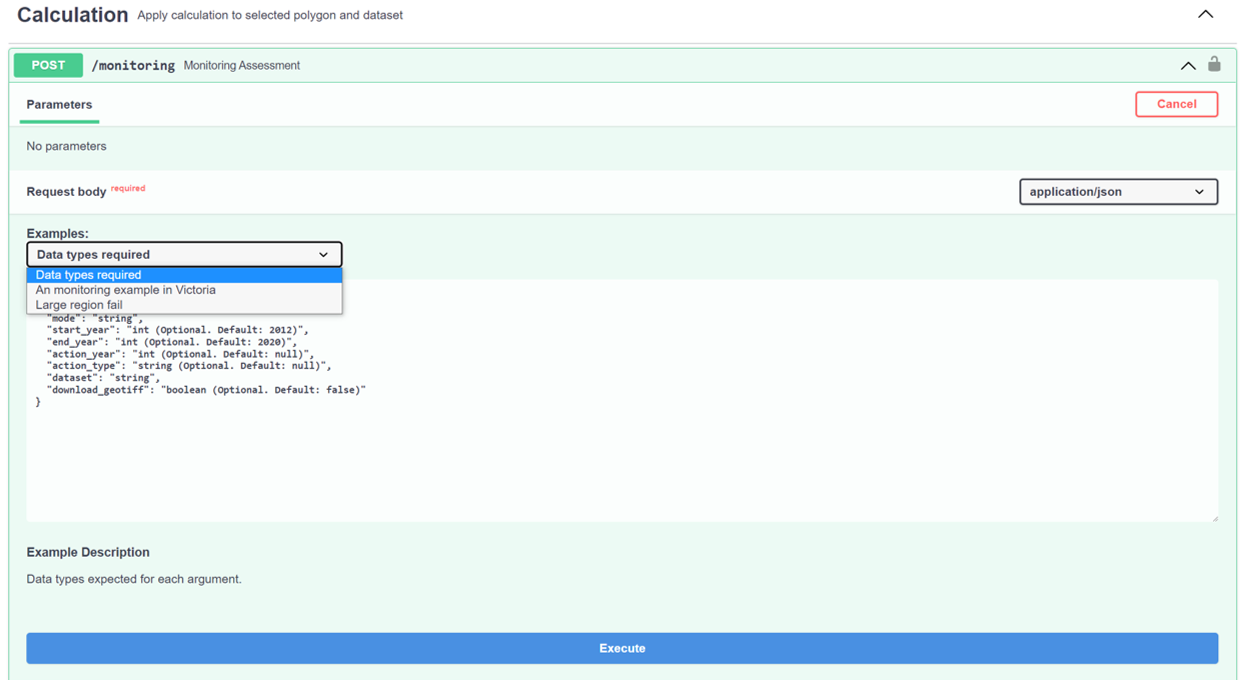
Select an example from the examples drop-down menu, and hit the ![]() button down the button to run the selected example. You can edit the example to suit your own assessment region.
button down the button to run the selected example. You can edit the example to suit your own assessment region.
What's in a request response
The response returns a JSON object with the following structure:
{
    "assessment_area": "number",
    "datasets":
    [{
            "name": "string",

            "summary": {
                "mean_percent_changes": {
                    "values": {
                        "starting_observation": "number",
                        "latest_observation": "number",
                        "expected_change": "number"
                    },
                    "units": "percent"
                },
                "potential_change_habitat_area": {
                    "values": {
                        "potential_change_ha": "number"
                    },
                    "units": "string"
                }
            },

            "annual_averages": {
                "mean": {
                    "2012": "number"
                },
                "fifth_percentile": {
                    "2012": "number",
                },
                "ninety_fifth_percentile": {
                    "2012": "number"
                }
            },

            "figure": "base64",

            "geotiff": {
              "bounds": {
                "left": "number",
                "bottom": "number",
                "right": "number",
                "top": "number"
              },
              "images": {
                "2012": "base64 string"
              },
              "url": "string"
              }

        }]

}
The following provides some more detail of a datasets item.
name
Simply the name of the indicator or leading indicator provided. Currently available:
Habitat condition
summary
mean_percent_changes
values
Includes:
- Value of the
latest_observationin the time series requsted- The
maximum_forecastvalue- The
expected_changevalue
annual_averages
mean
Includes:
- For each year in the specified time range, the annual spatially averaged proportion of intact habitat.
fifth_percentile
Includes:
- For each year in the specified time range, the annual fifth percentile value of the proportion of intact habitat.
ninety_fifth_percentile
Includes:
- For each year in the specified time range, the annual ninety-fifth percentile value of the proportion of intact habitat.
figure
A figure which plots the annual spatially averaged percentage of habitat condition over the time range specified in the time series.
geotiff
bounds
The bounding box of the dataset.
images
In monitoring mode, a separate PNG image is provided for each year of the assessment. In planning mode, a separate image is provided for the beginning and end year of the forecast period (latest year of habitat condition data, through to 2045).
url
GeoTIFF dataset for the region of interest over the time period requested. In the planning mode this is truncated to the first and last year of the forecast. GeoTIFF band names correspond to each year provided (where the initial year in the time series is the first band). The dataset can be retrieved from the returned URL.